CelinQ Insights · No. 56
Who is actually in sync? Monitoring distributed Enterprise Architect repositories
A fleet of local repositories is only as trustworthy as your ability to answer, for any one of them, "where is it right now, and how far behind is it?"
Ask an administrator responsible for a shared Sparx Enterprise Architect database whether the model is "up" and the answer is almost always a simple one. Either the database service is reachable and everyone is working against it, or it is not and nobody is. There is exactly one place for the truth to live, and monitoring that single place is a solved problem: ping it, check its disk, check its connection count, done. The moment you move to a local-first architecture, where every architect carries a genuinely complete, genuinely writable copy of the model on their own laptop, that question stops having a single answer. There is no longer one place where the truth of "is everything in sync" lives. There are as many places as there are architects, each one potentially a little different from the canonical state at any given moment, and the interesting question is no longer whether the system is up. It is who, precisely, is in sync, who is behind, and by how much.
This is not a hypothetical concern raised to justify a new dashboard. It is the direct consequence of the trade-off that makes local-first modelling fast and resilient in the first place. If every read and write had to go through a central server, you would never need to ask whether a client was behind, because a client cannot fall behind a server it consults on every keystroke. The price of local speed and offline continuity is that divergence becomes a normal, continuous, low-level fact of life rather than an emergency. The job of monitoring in this world is not to prevent divergence — divergence is the whole point, it is what lets an architect keep working on a train — but to make divergence visible, bounded, and explainable, so that nobody discovers a problem by accident three weeks after it started.
The vocabulary a local-first fleet actually needs
Centralised monitoring vocabulary — uptime, connection count, query latency — describes a server. It has almost nothing to say about a fleet of independent repositories that synchronise asynchronously. What you actually need to know, for each client, is a small and specific set of facts, and it is worth naming them plainly because they map directly onto what CelinQ's Control Plane surfaces.
The first is the client's own head: the revision number of the last change that client has actually applied to its local repository. The second is the server head: the revision number that represents the current canonical state of the workspace. The gap between those two numbers — the revision lag — is the single most useful number in the whole system, because it converts an abstract worry ("is this laptop up to date?") into a concrete, comparable quantity. A lag of zero means the client has seen everything the server has committed. A lag of three means there are three committed changesets sitting on the server that this particular client has not yet pulled down. That number alone tells you far more than "connected" or "disconnected" ever could, because a client can be technically online and still be several revisions behind if its subscription has stalled, and a client can be offline and perfectly fine, quietly accumulating a lag it will close the moment it reconnects.
Client head and server head only mean something once you also know whether the client is online or offline, because the correct response to a lag of eight is completely different in each case. An online client with a growing lag is a sign that something in its synchronisation pipeline is not working the way it should — the notification stream may have dropped, the debounce may be stuck, or the client machine may be under enough load that background synchronisation is being starved. An offline client with the same lag of eight is doing exactly what it is supposed to do: holding its work locally, unbothered, waiting for a network. Distinguishing the two is the difference between an alert that deserves an administrator's attention and a status that is simply Tuesday for someone working from a client site with patchy wifi.
Pending operations complete the picture, and there are two distinct queues worth naming separately. Pending local operations are changes an architect has made that have not yet been pushed to the server — the backlog sitting on their machine, whether because they are offline, because Smart Sync's debounce window has not yet closed, or because a push attempt failed and is waiting to retry. Pending remote operations are changes the server has already accepted from other clients that this particular client has not yet pulled and applied. The two queues answer different questions. A large pending-local queue tells you this person's own work has not yet reached anyone else. A large pending-remote queue tells you this person is looking at a model that is meaningfully behind what their colleagues have already committed. An architect who has been offline for a day will typically show both, and that is expected. An architect who has been online the whole time and still shows a growing pending-remote queue is the case worth a second look.
Uptime answers "is the server alive?" Revision lag answers "does what this person is looking at match what the team actually agreed?" For a distributed model, the second question is the one that matters.
Last successful sync and the problem of staleness
Alongside the current lag, the timestamp of a client's last successful synchronisation matters in its own right, because lag and time are not the same axis and both are needed to tell a healthy pattern from a worrying one. A client that synchronised successfully ninety seconds ago and currently shows a lag of two is behaving exactly as designed — Smart Sync's fast path debounces briefly before pushing, and a small, closing gap is the normal rhythm of collaborative work, not a fault. A client whose last successful sync was six days ago is a different animal entirely, regardless of what its current lag number happens to read, because six days is long enough that the explanation matters: is this an architect on planned leave, a laptop that has been switched off in a drawer, or a client whose companion agent silently stopped running after an update and has not pushed a single changeset since? All three produce a stale timestamp. Only monitoring that surfaces the staleness in the first place gives anyone the chance to tell them apart.
This is where the idea of a stale client earns its place as a distinct monitoring category, separate from "offline." Offline is a normal, expected, frequently correct state for a local-first client to be in — it is the state an architect is deliberately in on a flight, and nothing about it should trigger concern on its own. Stale is different: it is a client whose absence has stretched well past what any ordinary pattern of disconnected work would explain, to the point where it is worth an administrator asking a human question rather than a technical one. Where exactly the line sits between "offline, unremarkable" and "stale, worth a check" is a judgement call for each organisation to set, and a Control Plane view that surfaces last-sync time per client, sortable, lets an administrator make that call with real information rather than a guess. The point of naming the category at all is to stop staleness from being invisible. A client that never shows up in any view because it has quietly stopped synchronising is a much worse failure mode than one that shows up flagged in red.
Error rate and the difference between a conflict and a failure
Not every sync attempt succeeds cleanly, and the vocabulary for failure needs to be more precise than a single red indicator, because two very different things can make a push fail and they call for opposite responses. The first is a genuine transport or server-side failure: the network dropped mid-request, the server returned an error, authentication expired. These are the events an error rate metric should count, and a rising error rate across the fleet — not one client having a bad afternoon, but the proportion of failed pushes climbing across many clients at once — is exactly the kind of signal that points at the server or the network path rather than at any individual architect's work. The second is a semantic conflict: a push that the server processed correctly but that collided with someone else's concurrent change in a way Fusion could not resolve automatically, producing an open decision rather than a completed sync. That is the mechanism doing exactly its job, not a failure of it, and lumping it into the same "error" bucket as a dropped connection would train administrators to ignore the metric, because most of what it reported would be normal collaborative friction rather than anything broken. CelinQ's server dashboard keeps these counted separately for exactly this reason: push failures on one axis, conflicts routed to Fusion on another, so a genuine reliability problem cannot hide behind a healthy afternoon of ordinary merge decisions.
Throughput: operations per minute as a second kind of signal
Lag, staleness and error rate all describe whether individual clients are healthy. A workspace-wide view of operations per minute — how many changes are flowing through the shared workspace, aggregated across all clients — describes something different: whether the team's actual collaborative rhythm looks like itself. This number is less about spotting a fault and more about noticing a change in shape. A team that normally produces a steady trickle of changes through the working day, with a visible dip at lunch and a lighter evening tail, has a recognisable signature. A sudden, sustained spike might simply mean a big modelling push before a deadline, which is unremarkable and even reassuring. A sudden, sustained flatline during normal working hours, on the other hand, is worth investigating regardless of what any individual client's lag says, because it can mean something upstream of individual clients has changed — a shared network path, a certificate that quietly expired, a server restart that clients have not yet reconnected past. Throughput is a workspace-level health signal in a way that lag, which is inherently per-client, cannot be on its own; the two views complement each other rather than substituting for one another.
What a percentile actually buys you, and being honest about what exists today
It is tempting, once you are tracking sync latency at all, to reach immediately for percentiles — the P50, P95 and P99 of how long a push takes from submission to server acknowledgement. The instinct is a good one and worth explaining properly, because an average alone is genuinely misleading for this kind of metric. If nine pushes complete in under a second and a tenth takes eight seconds because it landed during a burst of Fusion capsule creation, the average will report something like 1.7 seconds, which describes none of the ten pushes accurately. The P50 — the median — tells you what a typical push actually feels like for a typical architect on a typical day, which is usually reassuringly fast. The P95 or P99 tells you what the unlucky tail looks like: the pushes that happen to coincide with a large changeset, a busy server, or a slow connection, and it is the tail that determines whether "occasionally sluggish" ever crosses into "noticeably broken" for the architects who happen to hit it. Separating initial clone from incremental synchronisation matters here too, in exactly the way it matters for any honest performance benchmark: cloning a large repository for the first time and pushing a small incremental changeset are different operations with different natural durations, and averaging them together produces a number that describes neither.
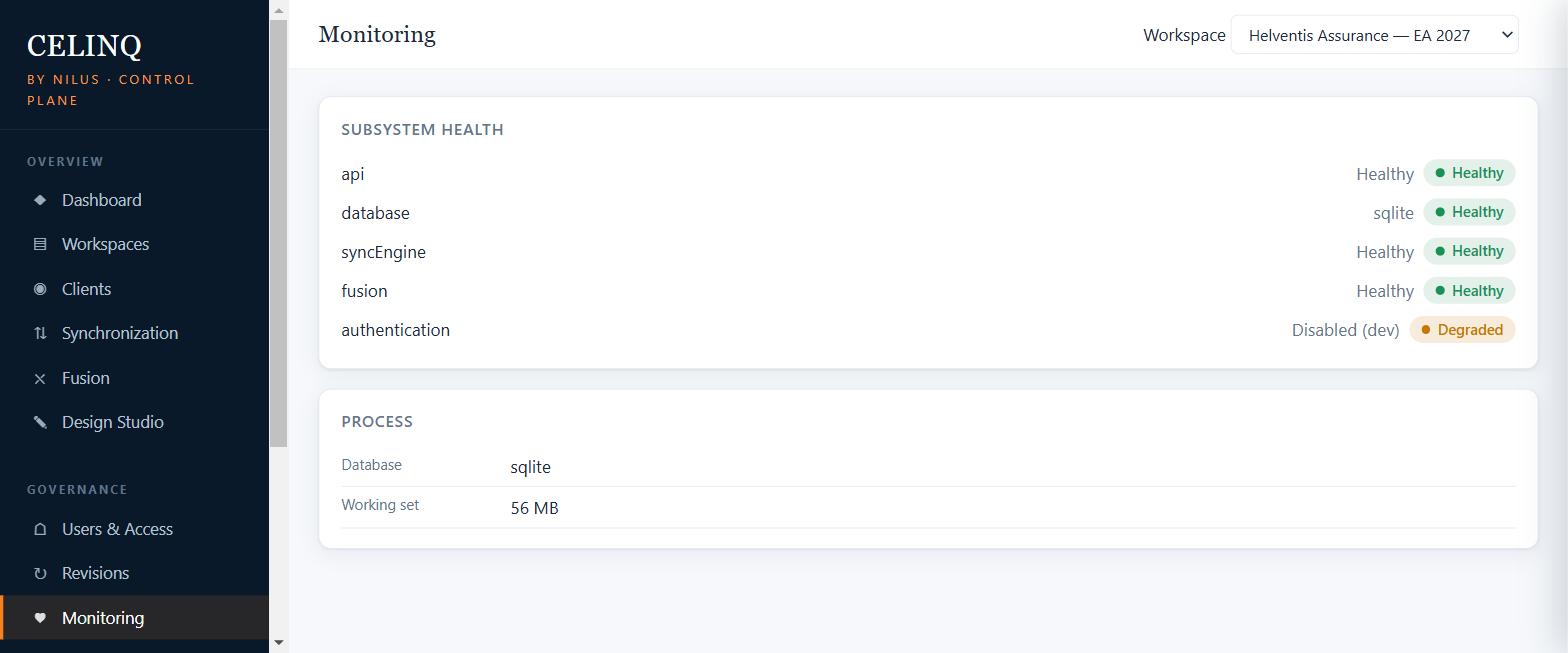
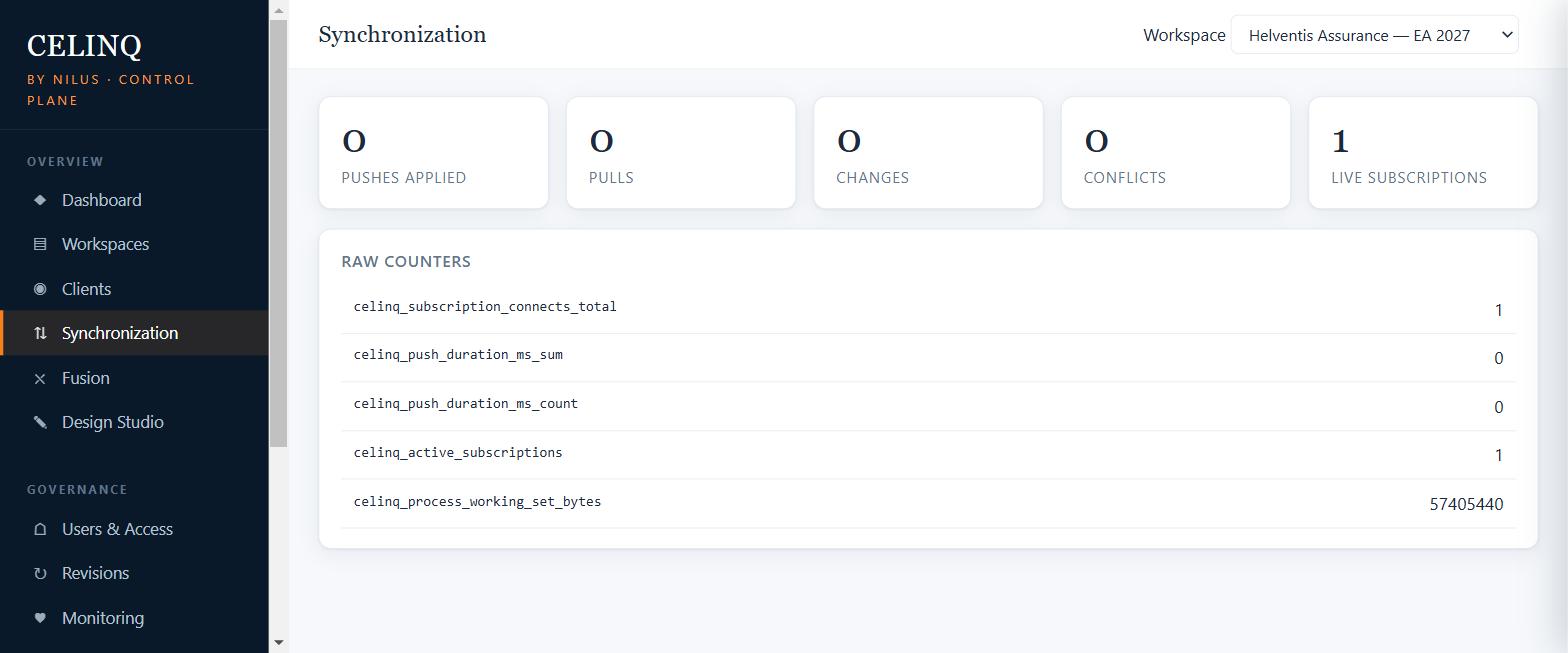
As things stand today, CelinQ's server exposes push counters, conflict counters, active-subscription counts and a push-duration total broken down as a sum and a count — which is enough to derive an average push duration, and enough for an administrator to notice a sustained shift in that average over time, but it is not yet a full percentile breakdown. A genuine P50/P95/P99 histogram of sync latency, exported per workspace and browsable in the Control Plane, is a natural and specific next step for the monitoring surface rather than something already sitting in a dashboard today. This is worth saying plainly rather than glossing over, because the whole argument of this article is that monitoring should tell you the truth about a distributed fleet, and it would be a strange way to make that argument by quietly overstating what the metrics currently show. What exists today — per-client revision lag, online/offline and staleness state, pending local and remote queues, last-successful-sync timestamps, push/pull/conflict counters, and workspace-wide throughput — already answers the operational question that matters most day to day: who is out of step, and is it explained by something ordinary. The finer-grained latency percentiles sharpen that picture further, and they are exactly the kind of number this series insists you should demand published, with a stated methodology, from any vendor including this one, rather than accepting a bare marketing claim.
The discipline that matters is not owning a percentile chart. It is refusing to let "the server is up" stand in for "everyone's model reflects reality." A fleet of local-first repositories needs monitoring built around the client, not the server, because the client is where the divergence — and the eventual convergence — actually happens.
What good monitoring changes about how a team actually operates
The value of all this is easiest to see through a concrete scenario. An architect based in a regional office has been complaining, informally, that "the model feels behind" — colleagues' changes seem to take a while to show up in their local repository, and they cannot tell whether that is normal or a sign of something wrong. Without per-client monitoring, this is a conversation an administrator can only have by guesswork: ask the architect to try restarting the companion agent, ask whether their office network has changed recently, wait to see if the complaint recurs. With a Control Plane that surfaces revision lag and last-sync time per client, the same investigation takes minutes. If that architect's client shows a lag that has been slowly climbing for two weeks while their last-sync timestamp keeps advancing every few minutes, the picture is clear: pushes and pulls are happening, but something in the fast path is degraded rather than broken — perhaps a consistently slow link that keeps missing the safety-sync window, worth a network conversation rather than a support ticket. If instead the last-sync timestamp is frozen from before the two weeks began, the diagnosis is completely different: the companion agent has stopped running, and the fix is a restart, not a network investigation. Neither diagnosis is guessable from "the model feels behind." Both are immediate from the right two numbers next to each other.
The same visibility changes how an administrator prepares for a workspace-wide event rather than reacting to an individual complaint. Before a major reorganisation of the model — the kind of change that touches hundreds of elements across several packages, the sort of work that benefits from everyone starting from the same base — it is worth confirming that the whole fleet is genuinely caught up rather than assuming it. A quick look at revision lag across every client in the workspace turns that assumption into a checked fact: if three laptops are sitting eleven revisions behind, that is worth resolving with those three architects before the big change lands on top of their stale base, rather than discovering the divergence afterwards as a much larger and more confusing Fusion capsule. This is the same instinct that motivates advisory presence — making the state of collaboration visible rather than assumed — applied at the level of the whole fleet instead of a single diagram.
Reading the fleet together, not client by client
Individual client metrics are the foundation, but the more experienced use of a monitoring surface is reading several clients together and noticing the shape that emerges. A workspace where every client's lag oscillates gently between zero and three, closing within a minute or two of any push, is a workspace where Smart Sync is doing precisely what it was designed to do: keeping the fast path fast without anyone having to think about it. A workspace where three specific clients consistently sit further behind than everyone else, day after day, is telling you something structural rather than incidental — perhaps those three are on a shared office connection with a slow uplink, perhaps they are the architects working the largest and slowest-to-synchronise part of the model, perhaps their machines are simply older and the companion agent is competing for resources with other software. None of these are emergencies, but all of them are useful for an administrator to know before a deadline arrives and the gap between "usually fine" and "not fine today" gets tested under pressure.
This kind of pattern-reading is also where monitoring and Fusion meet in practice, rather than staying in separate silos of the Control Plane. A workspace whose conflict rate has been quietly climbing week over week is worth cross-referencing against revision lag, because the two are often connected: clients that stay further behind for longer have a wider window in which someone else's concurrent edit can collide with their own, simply because more time has passed since their local copy last matched the canonical state. Bringing lag down — by investigating why those three laptops are consistently slow rather than treating the delay as background noise — is one of the few genuinely actionable levers an administrator has for reducing how often Fusion has to raise a human decision in the first place, precisely because Fusion capsules are more likely to appear when two people have been editing the same area from bases that have drifted further apart. Monitoring, in this sense, is not a passive readout sitting next to the collaboration machinery; reading it well and acting on what it shows is one of the more effective things an administrator can do to keep the whole team's experience of Fusion feeling occasional and manageable rather than constant.
Honest limits
None of this monitoring prevents divergence, and it should not be mistaken for a substitute for the actual reconciliation machinery underneath it. A dashboard that shows you a client is eleven revisions behind does not itself bring that client up to date; it tells you where to look, and the actual catching-up still happens through the same Smart Sync fast path, safety sync and deep reconciliation that keep every client honest without an administrator's intervention in the ordinary case. Monitoring is diagnostic and observational, not corrective, and treating a green dashboard as proof that nothing needs attention is exactly the mistake this article is arguing against — the dashboard is only as good as an administrator's willingness to actually look at it and ask what an unusual reading means.
There is also a genuine limit in what per-client visibility can tell you about intent. A client with a large pending-local queue might be an architect deep in focused offline work who will push everything cleanly the moment they reconnect, or it might be a client whose sync agent has silently wedged. The metrics narrow the space of explanations enormously compared with having no visibility at all, but they do not eliminate the need for a human, occasionally, to ask a colleague directly what is going on. And as noted plainly above, the latency percentiles that would make the tail behaviour of synchronisation fully transparent are not yet a shipped feature of the Control Plane; what exists today is real, useful and honestly the majority of what day-to-day operations need, but it is not the complete instrumentation story, and anyone evaluating this or any similar tool for a demanding environment should ask directly what is measured, over what window, and how it is derived, rather than accepting the word "monitoring" as self-explanatory. The whole discipline described here exists to replace exactly that kind of vague reassurance with a specific, checkable answer.
Recognise this in your own team? Get in touch — we’re happy to talk through whether CelinQ fits, no pressure either way.