CelinQ Insights · No. 57
The Enterprise Architect server dashboard should tell you more than "healthy"
A single green light tells you the process did not crash. It does not tell you whether the model your team is collaborating on is actually in good shape.
Most administration dashboards, for most kinds of infrastructure, converge on the same shape: a status indicator that is either a reassuring green or an alarming red, sitting above a handful of numbers nobody looks at until something has already gone wrong. For a stateless web service that shape is often adequate, because the failure modes of a stateless service are relatively simple — it is up, it is slow, or it is down. A server that coordinates synchronisation across a fleet of independent, offline-capable Enterprise Architect repositories does not have simple failure modes in that sense. It can be perfectly healthy in the narrow sense of accepting connections and returning fast responses, while quietly accumulating a backlog of conflicts nobody has resolved, or authenticating requests with a certificate that expires next Tuesday, or running a database that has not been backed up in three weeks because a scheduled job silently stopped firing. "Healthy" in the process-uptime sense and "healthy" in the sense that actually matters to an architecture team are two different claims, and a dashboard that only ever answers the first one is quietly failing at its job.
This matters more for a collaboration platform than for most infrastructure, because the thing being protected is not a website's availability but a shared architectural record that an entire organisation depends on for decisions. If the server that coordinates that record degrades in a way a shallow health check cannot see, the consequences are not an outage anyone notices immediately. They are quieter and worse: conflicts that go unresolved for weeks and slowly poison a workspace, a backup routine that has been silently failing since a credential rotated, an authentication path that started rejecting a subset of clients after a certificate update and nobody realised because the server itself never stopped responding. A dashboard built around a single status light would show green through all of it.
What "healthy" actually has to mean
Start with the layer that most monitoring stops at, because it is genuinely necessary even if it is not sufficient: API health and database health. CelinQ exposes these as distinct, separately checkable facts rather than one composite verdict — a liveness check that answers whether the process is running at all, a readiness check that answers whether it is currently able to serve requests correctly, and, underneath both, the state of the storage layer itself, whether that is a SQLite file on local disk or a PostgreSQL instance the organisation runs separately. Keeping these separate matters operationally. A server that is alive but not ready — perhaps mid-migration, perhaps waiting on a slow storage mount — should not be routed traffic by a load balancer, and conflating "alive" with "ready" is exactly the kind of shortcut that turns a brief internal hiccup into a wave of failed client pushes. This is the layer every reasonable monitoring setup gets right, and it is worth stating plainly rather than dwelling on, because it is the floor, not the differentiator.
The differentiator is everything above that floor, and it starts with connected clients and sync lag viewed at the scale of the whole server rather than one client at a time — a companion view to the per-client detail covered in the piece on monitoring distributed repositories, but aggregated so an administrator can see the shape of the entire fleet in one glance. How many clients are currently connected across all workspaces. What the distribution of revision lag looks like across them — mostly clustered near zero with a handful of outliers, or spread wide, which would suggest something systemic rather than a few individually slow connections. This aggregate view is what turns "I wonder if things are generally okay" into an answerable question, and it is the natural first thing an administrator checks at the start of a working day, the same way an operations team checks an aggregate error-rate graph before diving into individual incidents.
Retry rate and duplicate suppression: the signs of a network under strain
A local-first synchronisation protocol has to assume the network will misbehave, because it is designed precisely for architects working over VPNs, hotel wifi, and intermittent mobile connections. That assumption shows up as two specific mechanisms worth surfacing on a dashboard rather than leaving buried in logs. The first is retry rate: how often a client's push attempt fails and is automatically retried before it succeeds. A low, steady retry rate is simply evidence that the resilience mechanism is doing its job on an imperfect network — exactly what you would expect from a fleet that includes architects on client sites and trains. A retry rate that spikes and stays elevated is a different signal entirely, one that points at something upstream: a network path degrading, a load balancer misconfigured, a TLS certificate about to expire and causing intermittent handshake failures before it fails outright. The number itself does not diagnose the cause, but it tells an administrator exactly when to start looking, often well before the failure is severe enough that anyone would otherwise have noticed.
The second is duplicate suppression. Because the offline queue can, under genuine network failure, end up delivering the same changeset more than once — a push that succeeded on the server but whose acknowledgement never made it back to the client, so the client retries an operation the server already applied — the server has to recognise and discard duplicates rather than applying the same change twice. This is not a rare edge case dressed up as a feature; it is a routine consequence of building a protocol that tolerates real, unreliable networks rather than assuming a clean request-response cycle every time. Counting how often duplicate suppression actually fires tells an administrator something genuinely useful: a small, steady rate confirms the idempotency machinery is doing exactly the job it was built for, quietly, in the background, protecting the model from double-application without anyone noticing. A rate that jumps sharply is worth investigating on its own terms, because it usually means something in the network path between a specific client and the server has become considerably less reliable than usual, well before that unreliability shows up as a complaint.
Conflict rate and Fusion auto-merge rate, read together
Nothing on this dashboard deserves more careful presentation than the numbers around Fusion, because a naive reading of a rising conflict count is almost always the wrong reading. A workspace where more concurrent edits are colliding is not necessarily a workspace in trouble; it might simply be a workspace where more people are working more closely together on the same part of the model, which is a sign of an active, engaged team rather than a broken one. What actually matters is the relationship between two numbers taken together: the conflict rate — how often concurrent edits touch the same underlying fact — and the Fusion auto-merge rate — what proportion of those collisions Fusion resolves deterministically, with a proof-carrying rule code, versus how many it has to raise as a capsule for a human decision. A healthy pattern is a conflict rate that rises and falls with how actively the team is collaborating, alongside an auto-merge rate that stays roughly consistent, because that consistency is the sign that the deterministic rule engine — the same rules described in the piece on proof-carrying merges, codes such as DISJOINT_PROPERTY_WRITES and MAP_DISTINCT_KEYS among others — is behaving predictably regardless of how busy the day is.
What is actually worth an administrator's attention is a sustained drop in the auto-merge rate without a corresponding change in what the team is doing: the same kind of collaborative activity, but suddenly resolving automatically far less often than it used to. That pattern deserves investigation, because it can mean the nature of the collisions has genuinely shifted — perhaps a reorganisation has increased how often people restructure the same branches of the tree at once, which produces exactly the kind of tree-and-rename interaction that needs a human's judgement rather than a deterministic rule — or it can point at something worth reviewing in how the team has configured F1 policy merges. Either way, the dashboard's job is to put the right two numbers next to each other so a human with context about what the team is actually doing can draw the right conclusion, not to declare a verdict on its own — a raw capsule count, taken alone, tells you almost nothing about whether anything is actually wrong.
A conflict count on its own is nearly meaningless. A conflict count next to an auto-merge rate, read over time by someone who knows what the team has been working on, is one of the more informative single views a Fusion-backed server can offer.
Backup status is not a checkbox
Backup status belongs on an operational dashboard for a reason that has nothing to do with routine and everything to do with what happens the one day it matters. A backup that ran successfully six months ago and has silently failed every day since is, for practical purposes, no backup at all, and the only way to know the difference between "backups are running" and "backups ran once, a long time ago" is to surface the actual last-successful-backup timestamp somewhere an administrator will see it without having to go looking. CelinQ's Control Plane exposes an online backup action for the SQLite provider directly, producing an independently openable, consistent copy without taking the server offline, and it is worth being precise about where the honesty has to sit here: PostgreSQL-backed deployments are expected to use pg_dump or WAL archiving as their backup path rather than an equivalent online-backup button, and the server says so directly — it returns a clear response pointing administrators at that guidance rather than pretending an unsupported operation succeeded. A dashboard is only trustworthy if it is equally willing to say "this isn't done yet" as it is to show a green tick, and that distinction matters enormously the day someone actually needs to restore from a backup, a scenario covered in full in the piece on restoring a server while newer client state still exists.
Authentication status and audit activity
Authentication status is a quieter but equally important surface. Production deployments run in token mode, where every request carries a bearer token the server validates against a stored, salted hash, and the dashboard's job here is to make the state of that system visible rather than assumed: how many active tokens exist, whether the bootstrap admin token from first start has been rotated out for named user tokens, whether any tokens have recently been revoked, and — as a matter of honest accounting rather than routine reassurance — that authentication is genuinely enforced rather than left in the permissive "none" mode that exists for local development and is logged loudly precisely because it should never survive into a production deployment unnoticed. This is a case where a dashboard's most valuable function is catching a configuration mistake, not a runtime failure: a workspace that was set up quickly for a demonstration and never had authentication properly switched on is a much more dangerous silent failure than a server that is simply down, because a down server fails loudly and a misconfigured one does not fail at all — it just quietly exposes more than it should.
Audit activity closes the loop on all of the above, because every one of the events this article has described — a token issued, a backup taken, a workspace epoch bumped after a restore, a Fusion capsule resolved, a role changed — is recorded in an audit log with the acting user and a timestamp, readable by administrators through a dedicated endpoint. A dashboard that surfaces recent audit activity directly, rather than requiring someone to know the endpoint exists and go looking, turns an accountability mechanism that exists in principle into one that is actually used in practice. An audit trail earns its keep only once someone routinely glances at it and would notice if the pattern of activity looked wrong — an admin token issued at three in the morning, a role escalation nobody remembers requesting, a backup that ran from an unexpected source — not simply by existing somewhere in the database. None of that is useful if it takes a deliberate investigation to surface; it has to be part of the ordinary view.
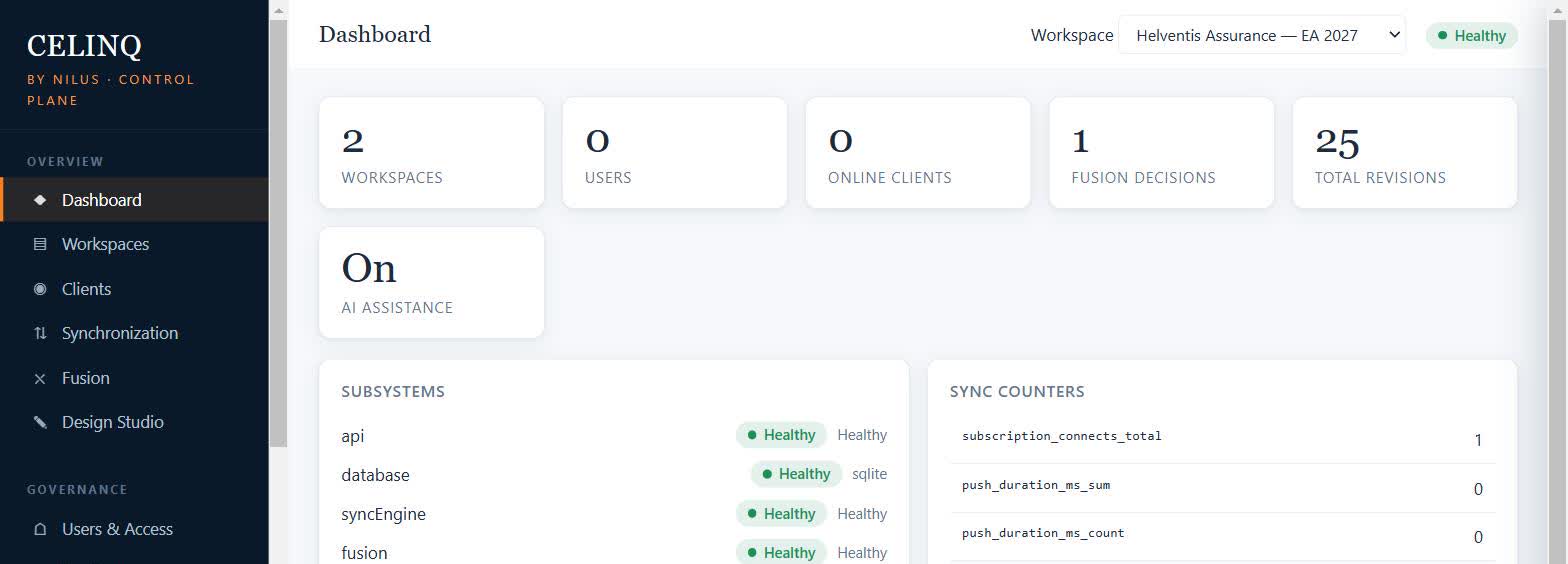
A dashboard earns its keep the day a number on it looks wrong. Retry rate, duplicate suppression, and the gap between conflict rate and auto-merge rate exist for exactly that day — not to reassure you every other day that everything is, unremarkably, fine.
Revisions: the record everything else on the dashboard is describing
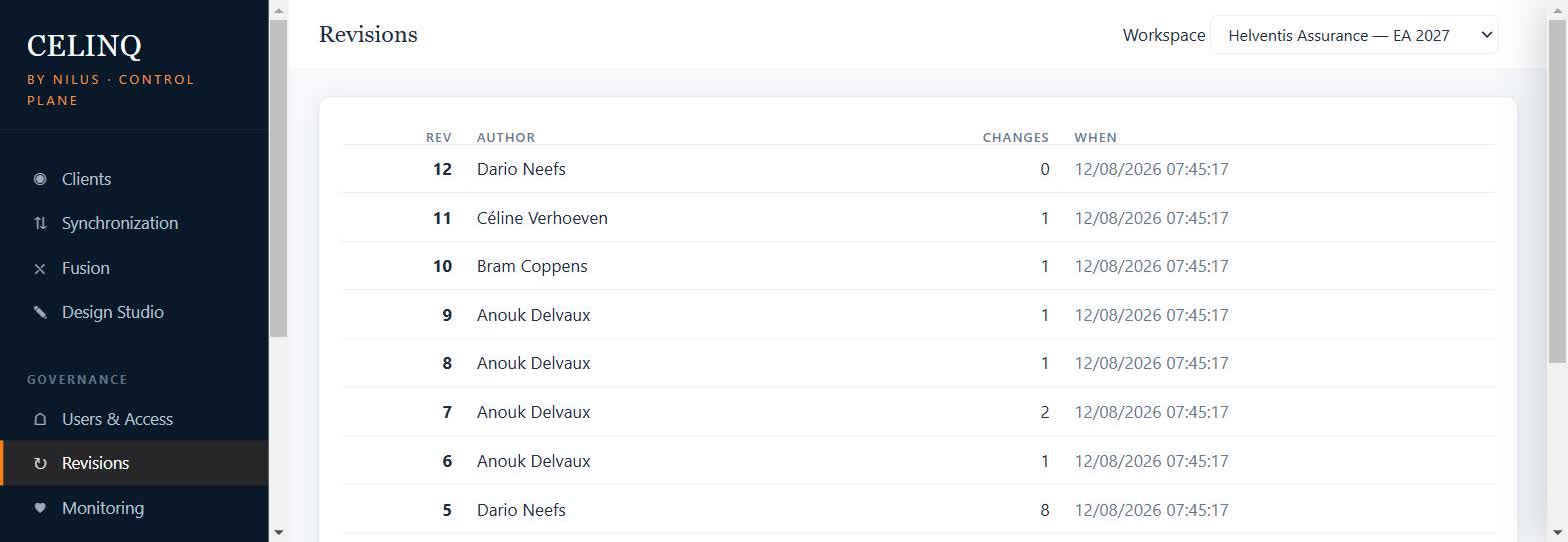
Every metric described so far is a summary of something. Behind the conflict rate is a specific set of Fusion decisions; behind the audit log is a specific sequence of administrative actions; behind sync lag is a specific gap between a client's head and a specific revision on the server. The revisions view is where that underlying record actually lives, and it belongs on the same dashboard rather than a separate screen, because it is the layer everything else is ultimately a statistic about. Each revision in a workspace is an ordered, immutable entry — who made it, how many entities it touched, when it landed — and taken together they form the same kind of ground truth for the model that a well-kept commit history forms for a codebase. When a dashboard number looks surprising, the revision list is where an administrator goes to stop reading a summary and start reading what actually happened: which specific changeset produced the spike in conflict rate, which specific author's pushes correlate with the retry-rate increase, whether the drop in auto-merge rate lines up with a particular afternoon of heavy restructuring by one architect rather than a change spread evenly across the team.
This is also where the case for keeping monitoring and revision history in the same administrative surface, rather than treating them as unrelated features, is strongest. A metric answers "how much" and "how often." A revision answers "what, exactly, and by whom." Neither is a substitute for the other, and a dashboard that offers only the aggregate numbers leaves an administrator staring at a graph with no way to drill into the specific event that produced the inflection point. Being able to move, in a couple of clicks, from a sync-lag chart that looks wrong to the actual revision list for the affected workspace, and from there to the specific changeset, is what turns "something looks off" into "here is exactly what happened and here is who to talk to." That path from summary to specific fact is, in the end, the entire point of operational monitoring: not to produce reassuring numbers, but to shorten the distance between noticing a problem and understanding it.
Operational alerts: the difference between a dashboard and a pager
Everything described so far assumes an administrator who chooses to look. The genuinely useful next step for any of these signals — retry rate spiking, auto-merge rate dropping without a corresponding change in team activity, a backup timestamp aging past its expected interval, a stale client that has not synchronised in days — is turning the ones that matter into operational alerts rather than numbers that sit passively in a view someone might or might not open that week. It is worth being direct about what this means in practice: alerting of this kind is a natural extension of metrics that are already exported in Prometheus text format from the server's `/metrics` endpoint, the same counters and gauges this article has been describing, ready to be scraped by whatever alerting stack an organisation already runs — Prometheus's own alerting rules, Grafana, or an equivalent. CelinQ's own Control Plane surfaces these views for a human glancing at them directly; wiring specific thresholds into an organisation's existing paging system is exactly the kind of integration a metrics endpoint in an open, standard format is meant to make straightforward, and it is the direction any serious operational deployment should take rather than relying on someone remembering to check a screen.
What changes when the dashboard tells the whole story
Consider the alternative to all of this, because it is the situation most teams are actually in today with a conventional shared repository: a database administrator who can tell you the SQL Server instance backing the shared Enterprise Architect repository is up, has acceptable disk space, and is accepting connections, and who genuinely cannot tell you whether the model itself is in good collaborative health, because a relational database server has no concept of "conflict rate" or "auto-merge rate" — those concepts do not exist until a tool like CelinQ introduces a merge layer with something to measure. The honest comparison is not that Pro Cloud Server or a shared database monitors badly; it is that the questions this article is asking — how much of our collaborative friction resolves itself automatically, how far behind is the slowest laptop in the fleet, did last night's backup actually succeed — are questions a synchronisation and merge layer makes it possible to ask in the first place. A dashboard that only reports "healthy" wastes that opportunity. A dashboard that reports conflict rate next to auto-merge rate, retry rate next to duplicate suppression, and backup status with an honest timestamp rather than a checkbox, turns server monitoring into something an architecture team can actually use to understand how well they are collaborating, not just whether a process happens to be running.
Honest limits
None of this instrumentation makes the underlying systems infallible, and a dashboard that implied otherwise would be doing exactly the kind of overselling this whole series tries to avoid. Metrics tell you where to look; they do not fix anything by themselves, and a rising retry rate still requires a human to investigate the actual network path behind it. Some of the alerting integration described here — wiring specific thresholds into an organisation's own paging system — is an extension any team can build on top of the exported Prometheus metrics, not a packaged, pre-configured alerting product shipped out of the box; the metrics exist to make that integration straightforward, but the integration itself is work an operations team does for its own environment. And as with the per-client monitoring covered elsewhere in this series, the finer-grained latency detail that would make some of these judgements sharper — a full percentile breakdown of push duration, for instance — is a natural next addition to the metrics surface rather than something already exposed today. What exists now is real, is drawn from the same counters the server actually increments in production, and genuinely goes well beyond a single status light. It is not, and should not be presented as, a finished, closed subject. A dashboard, like the platform it monitors, is something you keep making more honest over time rather than something you declare complete.
Recognise this in your own team? Get in touch — we’re happy to talk through whether CelinQ fits, no pressure either way.